Max Temperature

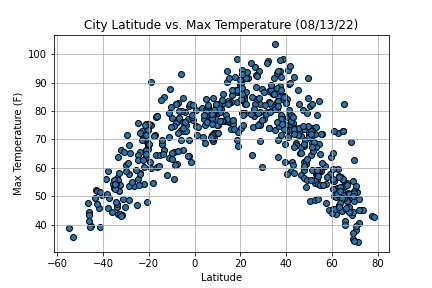
This plot is analyzing max temperature in Farenheit for cities at various distances from the equator. It shows what is generally expected, temperatures decrease as you move further away from the equator.

This plot is analyzing max temperature in Farenheit for cities at various distances from the equator. It shows what is generally expected, temperatures decrease as you move further away from the equator.